How it works
From a bus's GPS to the minute on your screen
Most campus bus tracking passes a vendor's numbers through to riders. Dwell rebuilds them from the GPS itself. Every stage below is something Dwell operates, so it can also publish how accurate the result turns out to be.
Start
It starts with the schedule
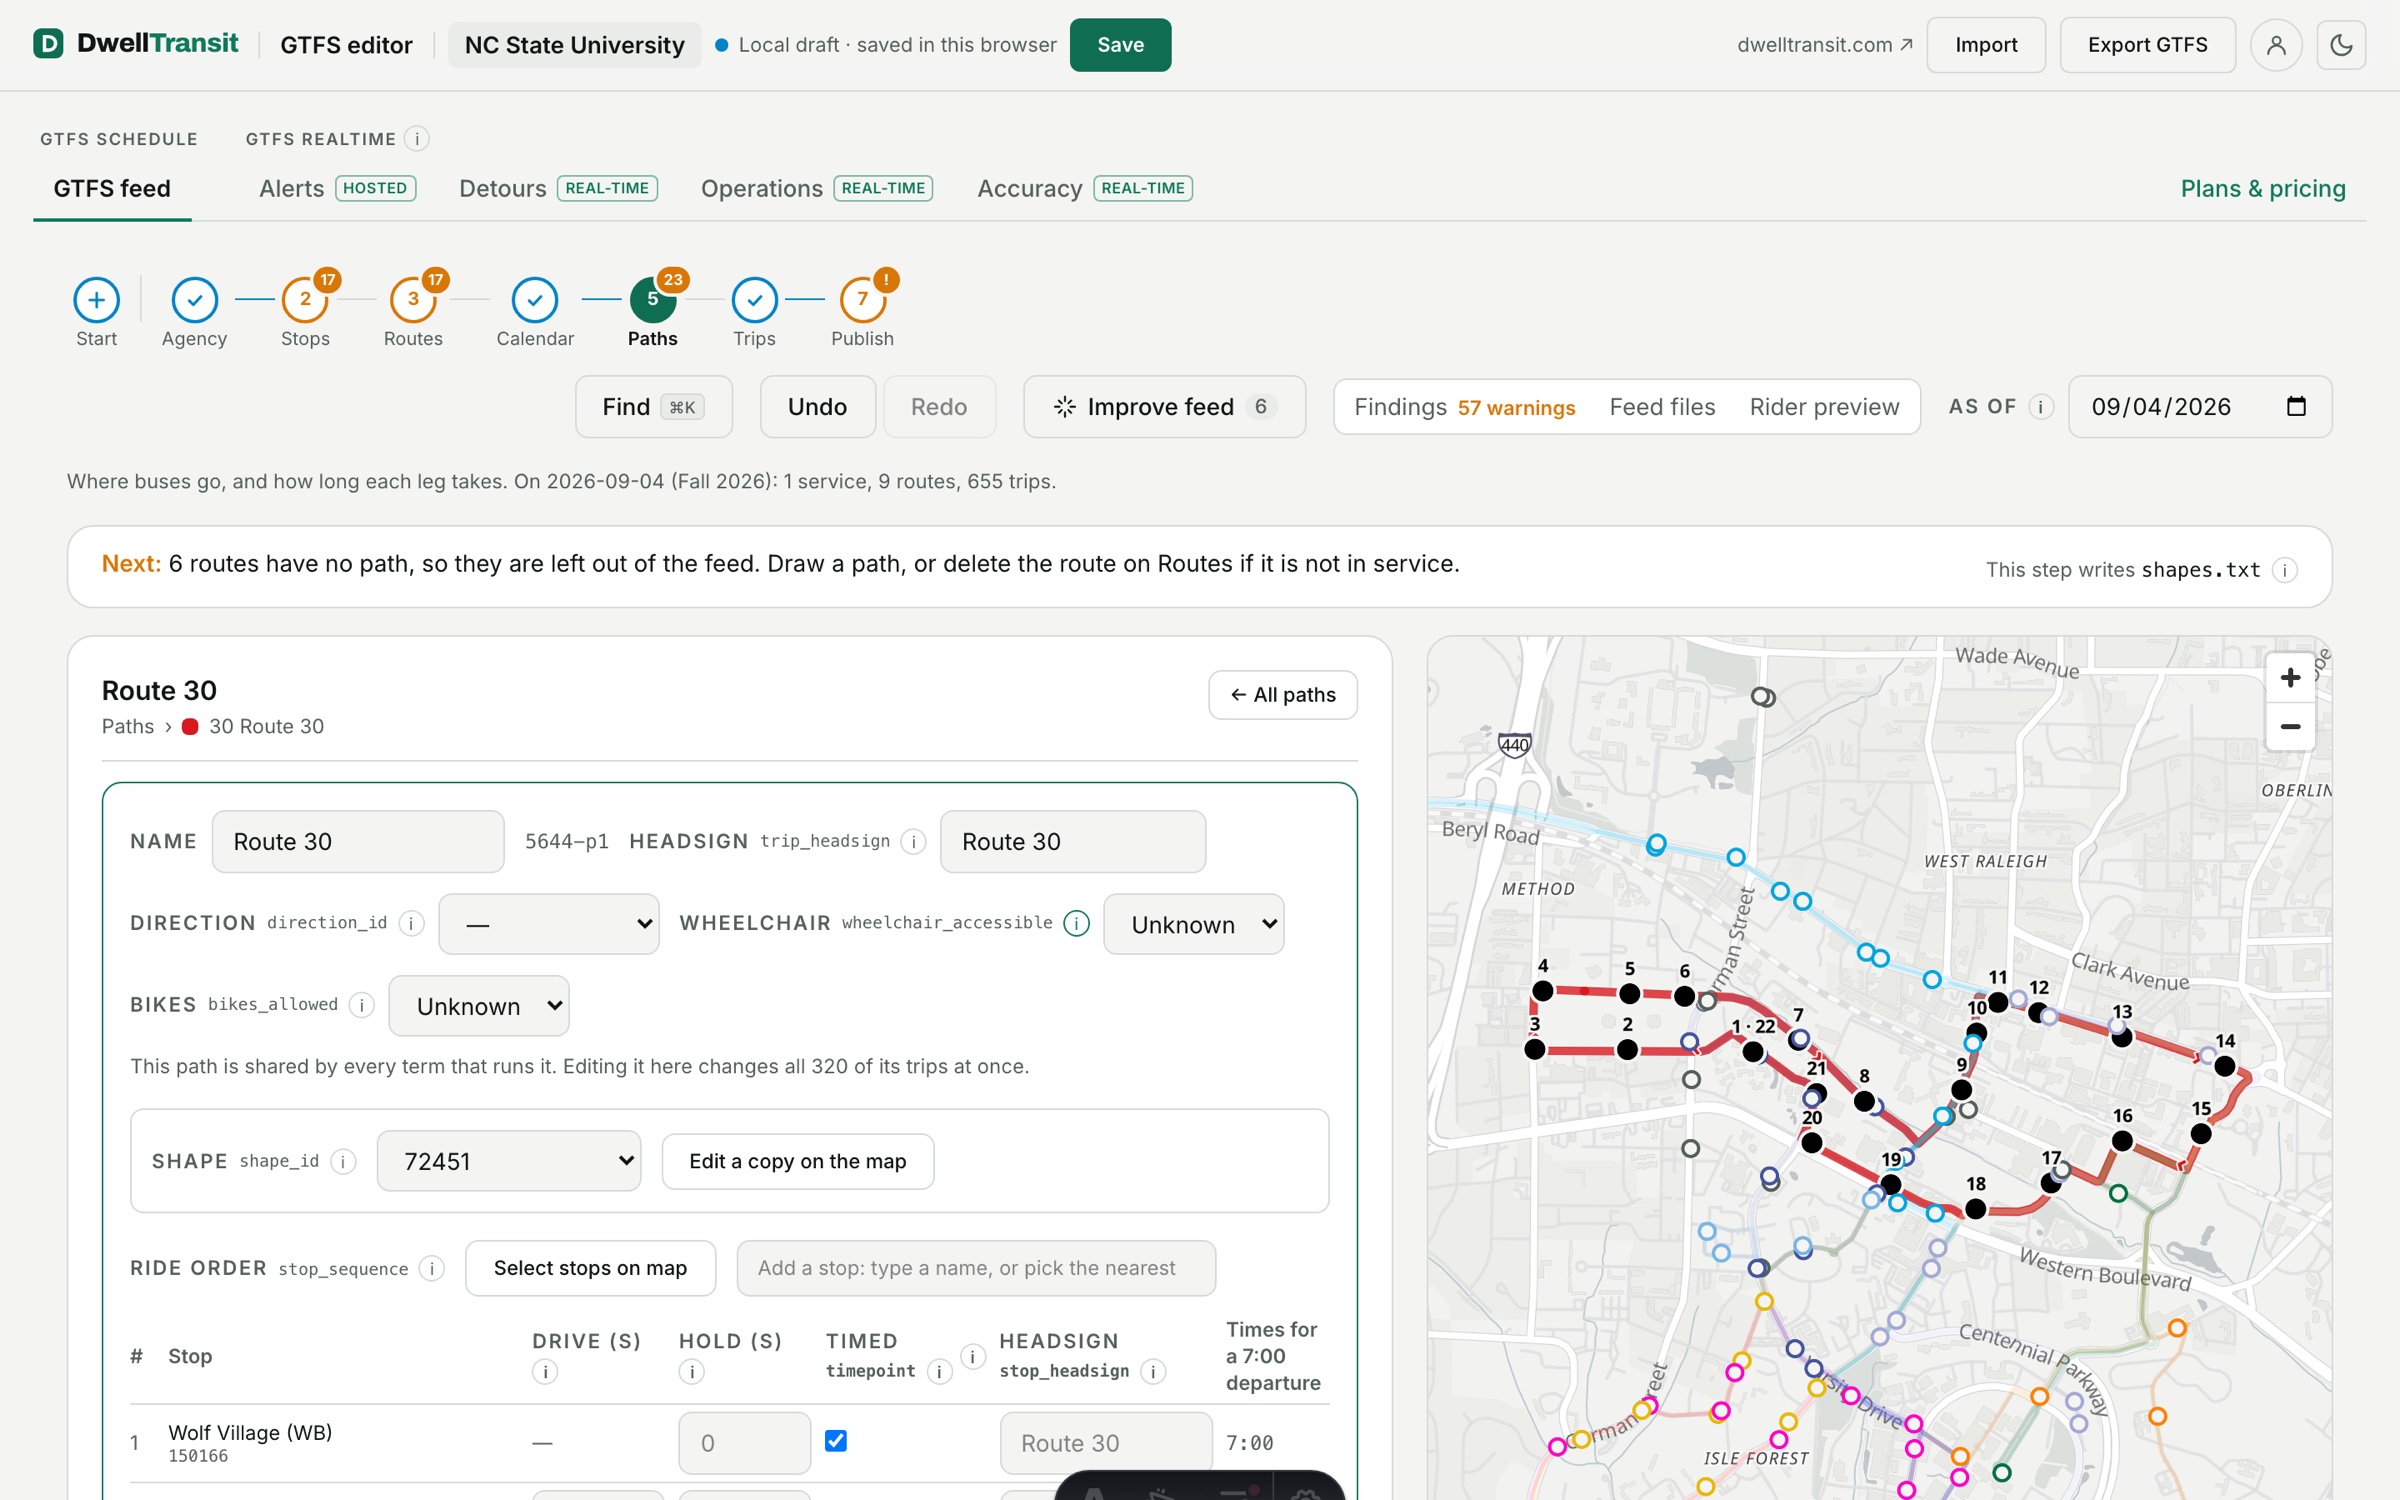
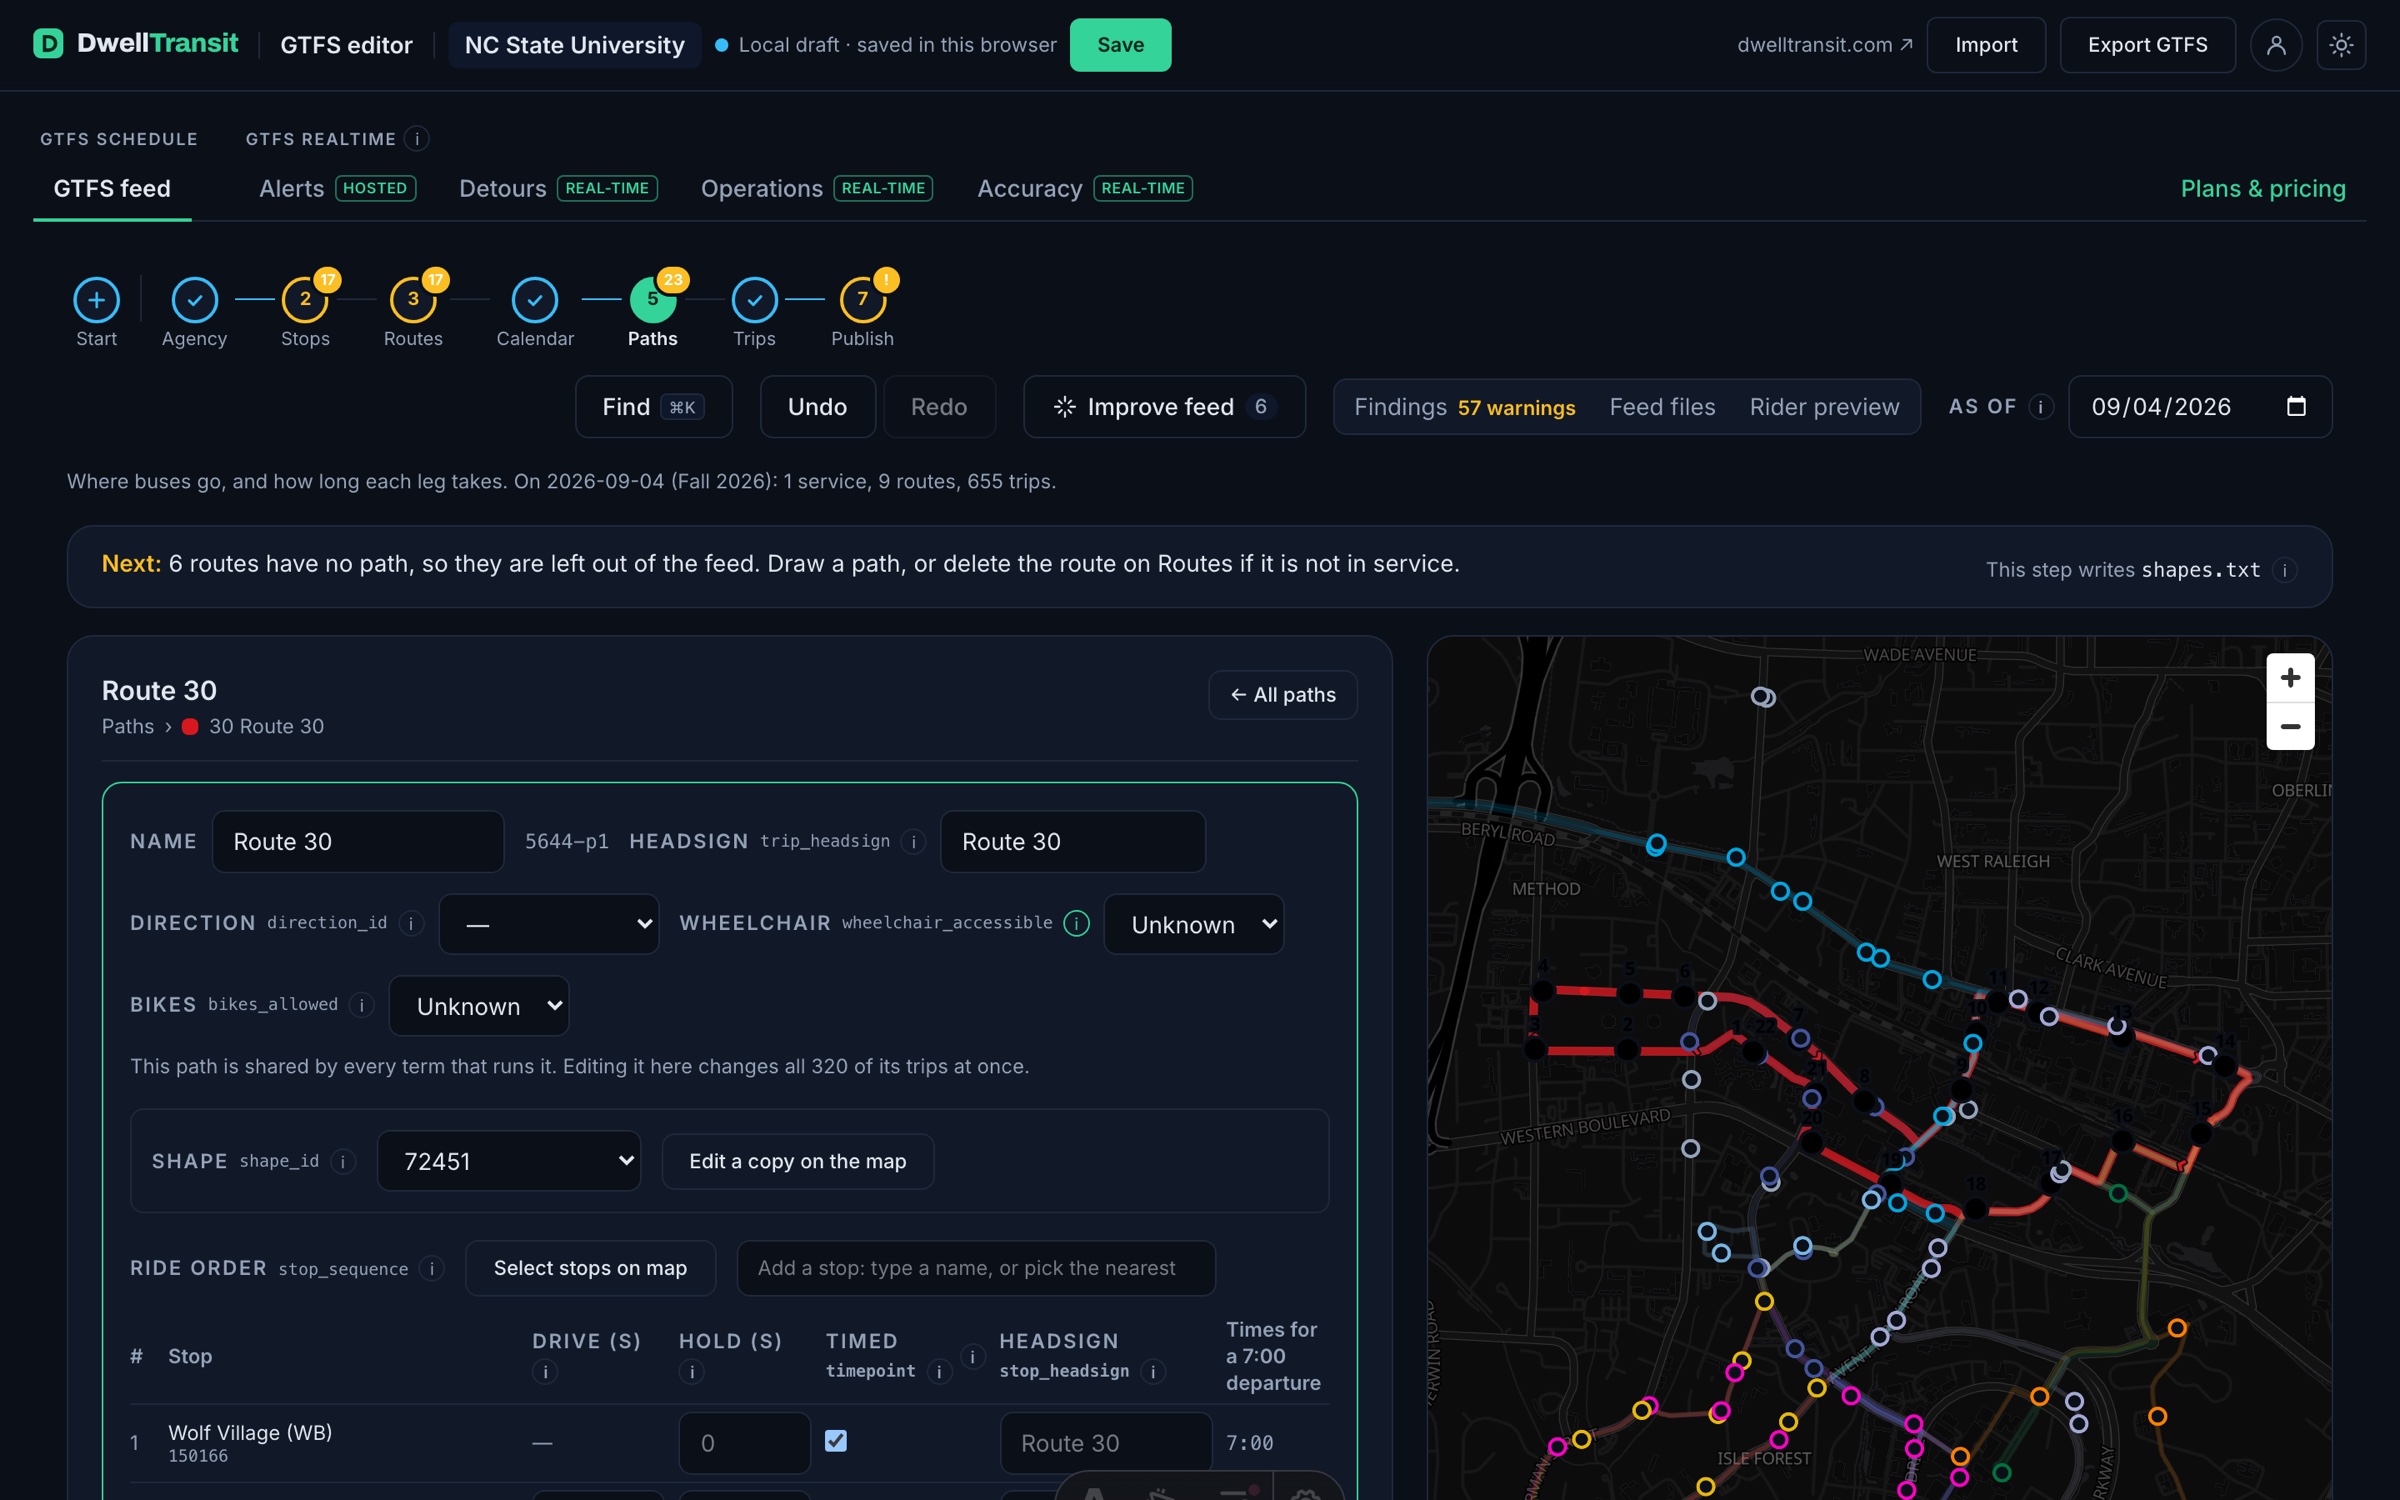
Everything downstream reads the schedule, so Dwell begins there. Bring the GTFS feed you already publish, or build one from a map: the editor imports a feed in the browser, lists every finding against the spec, and proposes the repairs (spelled-out stop names, timing points, dated terms in place of a thousand exception rows) before any of them lands. Nothing leaves your browser until you export.
The same editor sits inside the agency console. There, publishing puts the corrected feed at one stable URL that trip planners read, rebuilt whenever it changes, and next term can be drafted for weeks while this term keeps publishing.
Stage one
Start from what the bus can measure
A bus reports a handful of facts a receiver can measure directly: latitude, longitude, speed, heading, and the moment it was recorded. Dwell builds on those.
Tracking systems usually also report which route and which trip a bus is on. Those fields were inferred somewhere upstream, and when the inference is wrong, every arrival time built on it is wrong in the same direction. Dwell works out route, direction, trip and next stop for itself, from the position and the published schedule. It is more work, but it means the numbers hold up.
As the receiver reports it
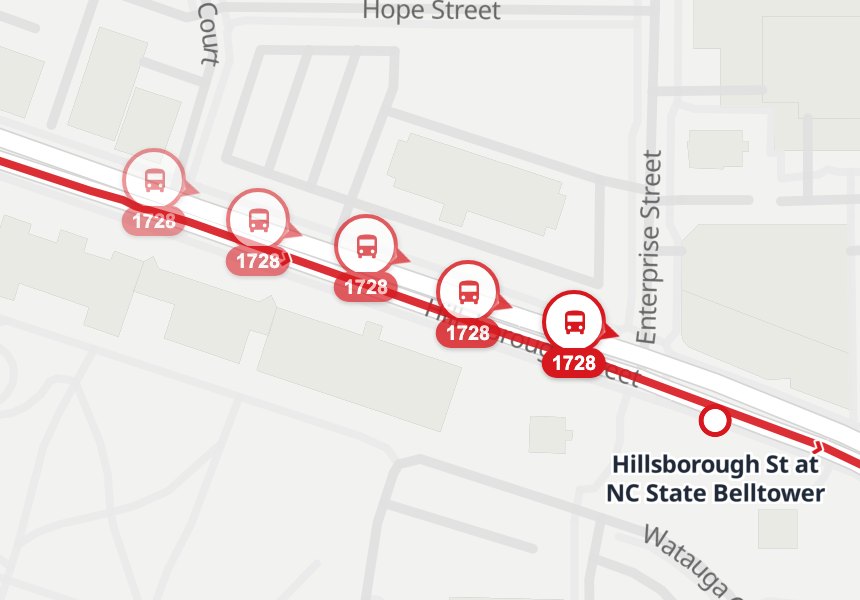
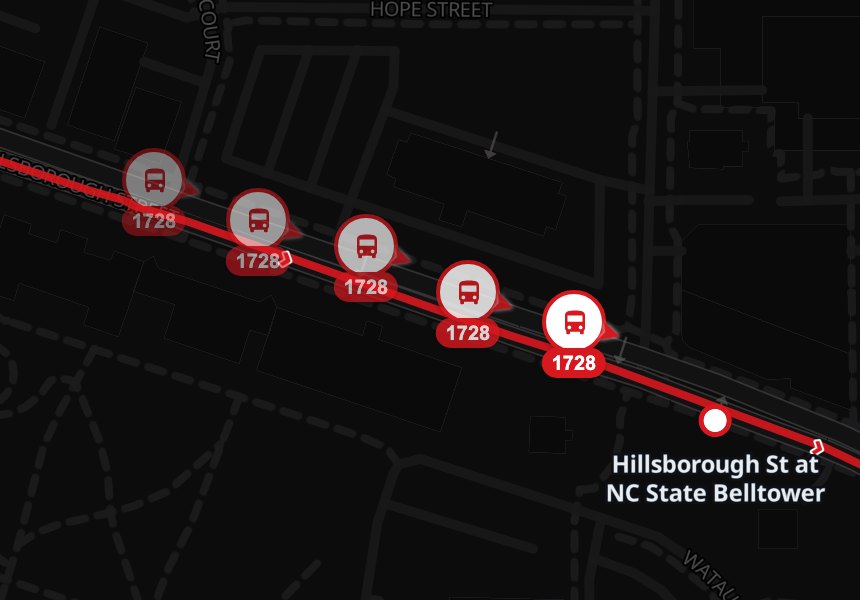
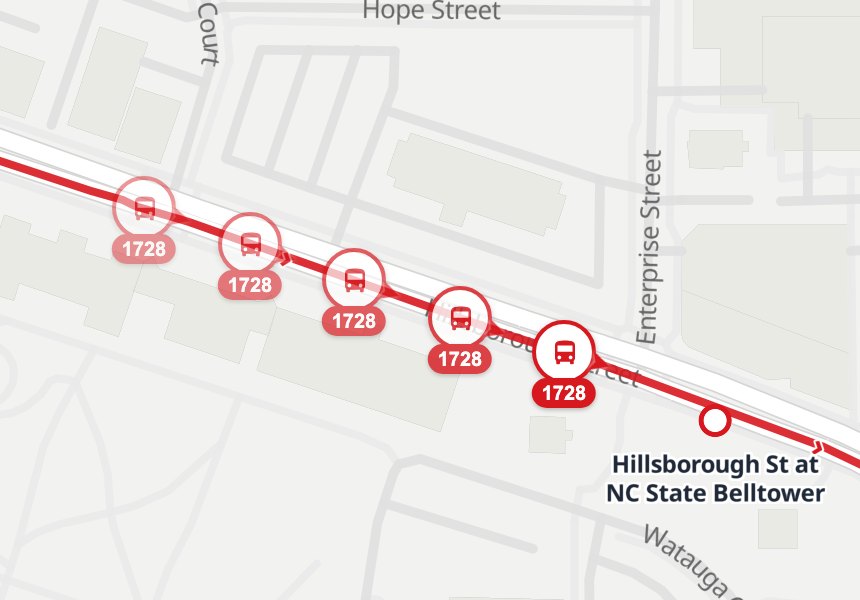
Five fixes from one bus, a few seconds apart, where the GPS receiver put them: beside the road as often as on it.
Snapped to the route
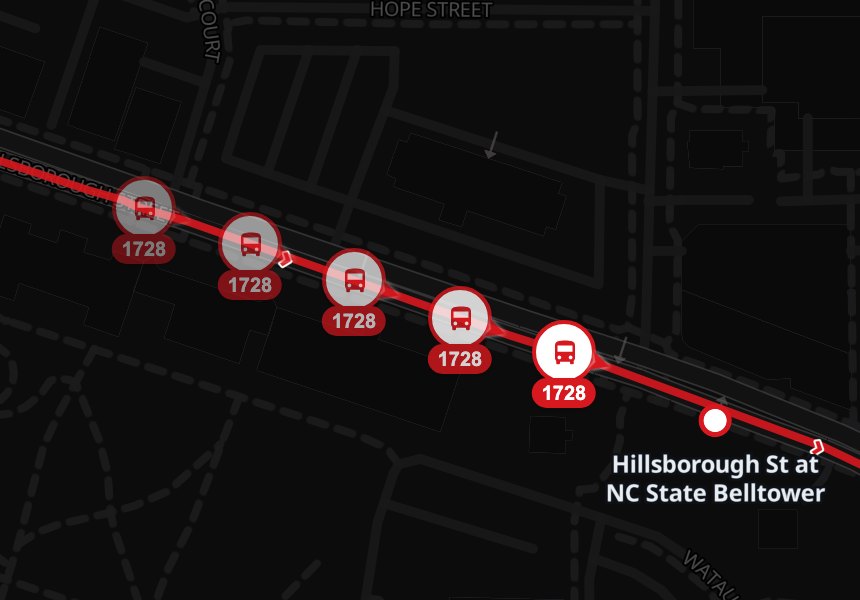
The same five fixes on the published line, which is what tells the engine how far along the route the bus is and which stop is next.
Stage two
Learn how your campus moves
A schedule says a bus takes four minutes between two stops. On the road it takes four at 6am, five at the end of the afternoon, and a little less late at night. Dwell measures this directly: every time a bus travels between two stops, or waits at one, that becomes an observation, and the observations are what the predictions are built from.
They are filed by the kind of day and the part of the day, and both come from the published schedule with nothing to configure: days that run the same services pool together (weekdays with weekdays, weekends with weekends, a Friday with its own late service on its own), and the clock is cut into five broad windows, morning, midday, evening, late night and overnight. Finer windows, such as the minutes around a class change, are an option an agency can turn on. On the first campus Dwell measured they added little to the shape of the day for drive times, so the default stays simple, and what a hop took last term still counts this term.
Stage three
Build the prediction from three things at once
Every arrival time combines the schedule, what this stretch of road usually takes at this time on this kind of day, and what buses on the route have done in the last few minutes. Today's conditions adjust the historical answer but can't replace it, so one bus stuck at one light doesn't throw off the whole route.
Stage four
Publish it in formats you already own
Everything Dwell produces is published as GTFS and GTFS-Realtime, the open formats that transit apps, trip planners, and signage systems already read. Nothing is locked behind a proprietary interface, and a university that leaves takes its data with it.
Publishing puts the feeds on a URL; getting them in front of riders in Google Maps, Apple Maps and Transit is a registration with each, and Google watches a feed for weeks first. The guide for agencies says what each one needs and who does what.
The schedule itself: routes, stops, trips, calendars and shapes. Dwell corrects the source feed and republishes a clean, standards-compliant bundle. Read by: Trip planners, transit apps, campus sites
Where every bus is right now, snapped to its route and matched to a trip. Read by: Live maps, third-party apps
Predicted arrival and departure times for every upcoming stop on every active trip. Read by: Arrival displays, third-party apps
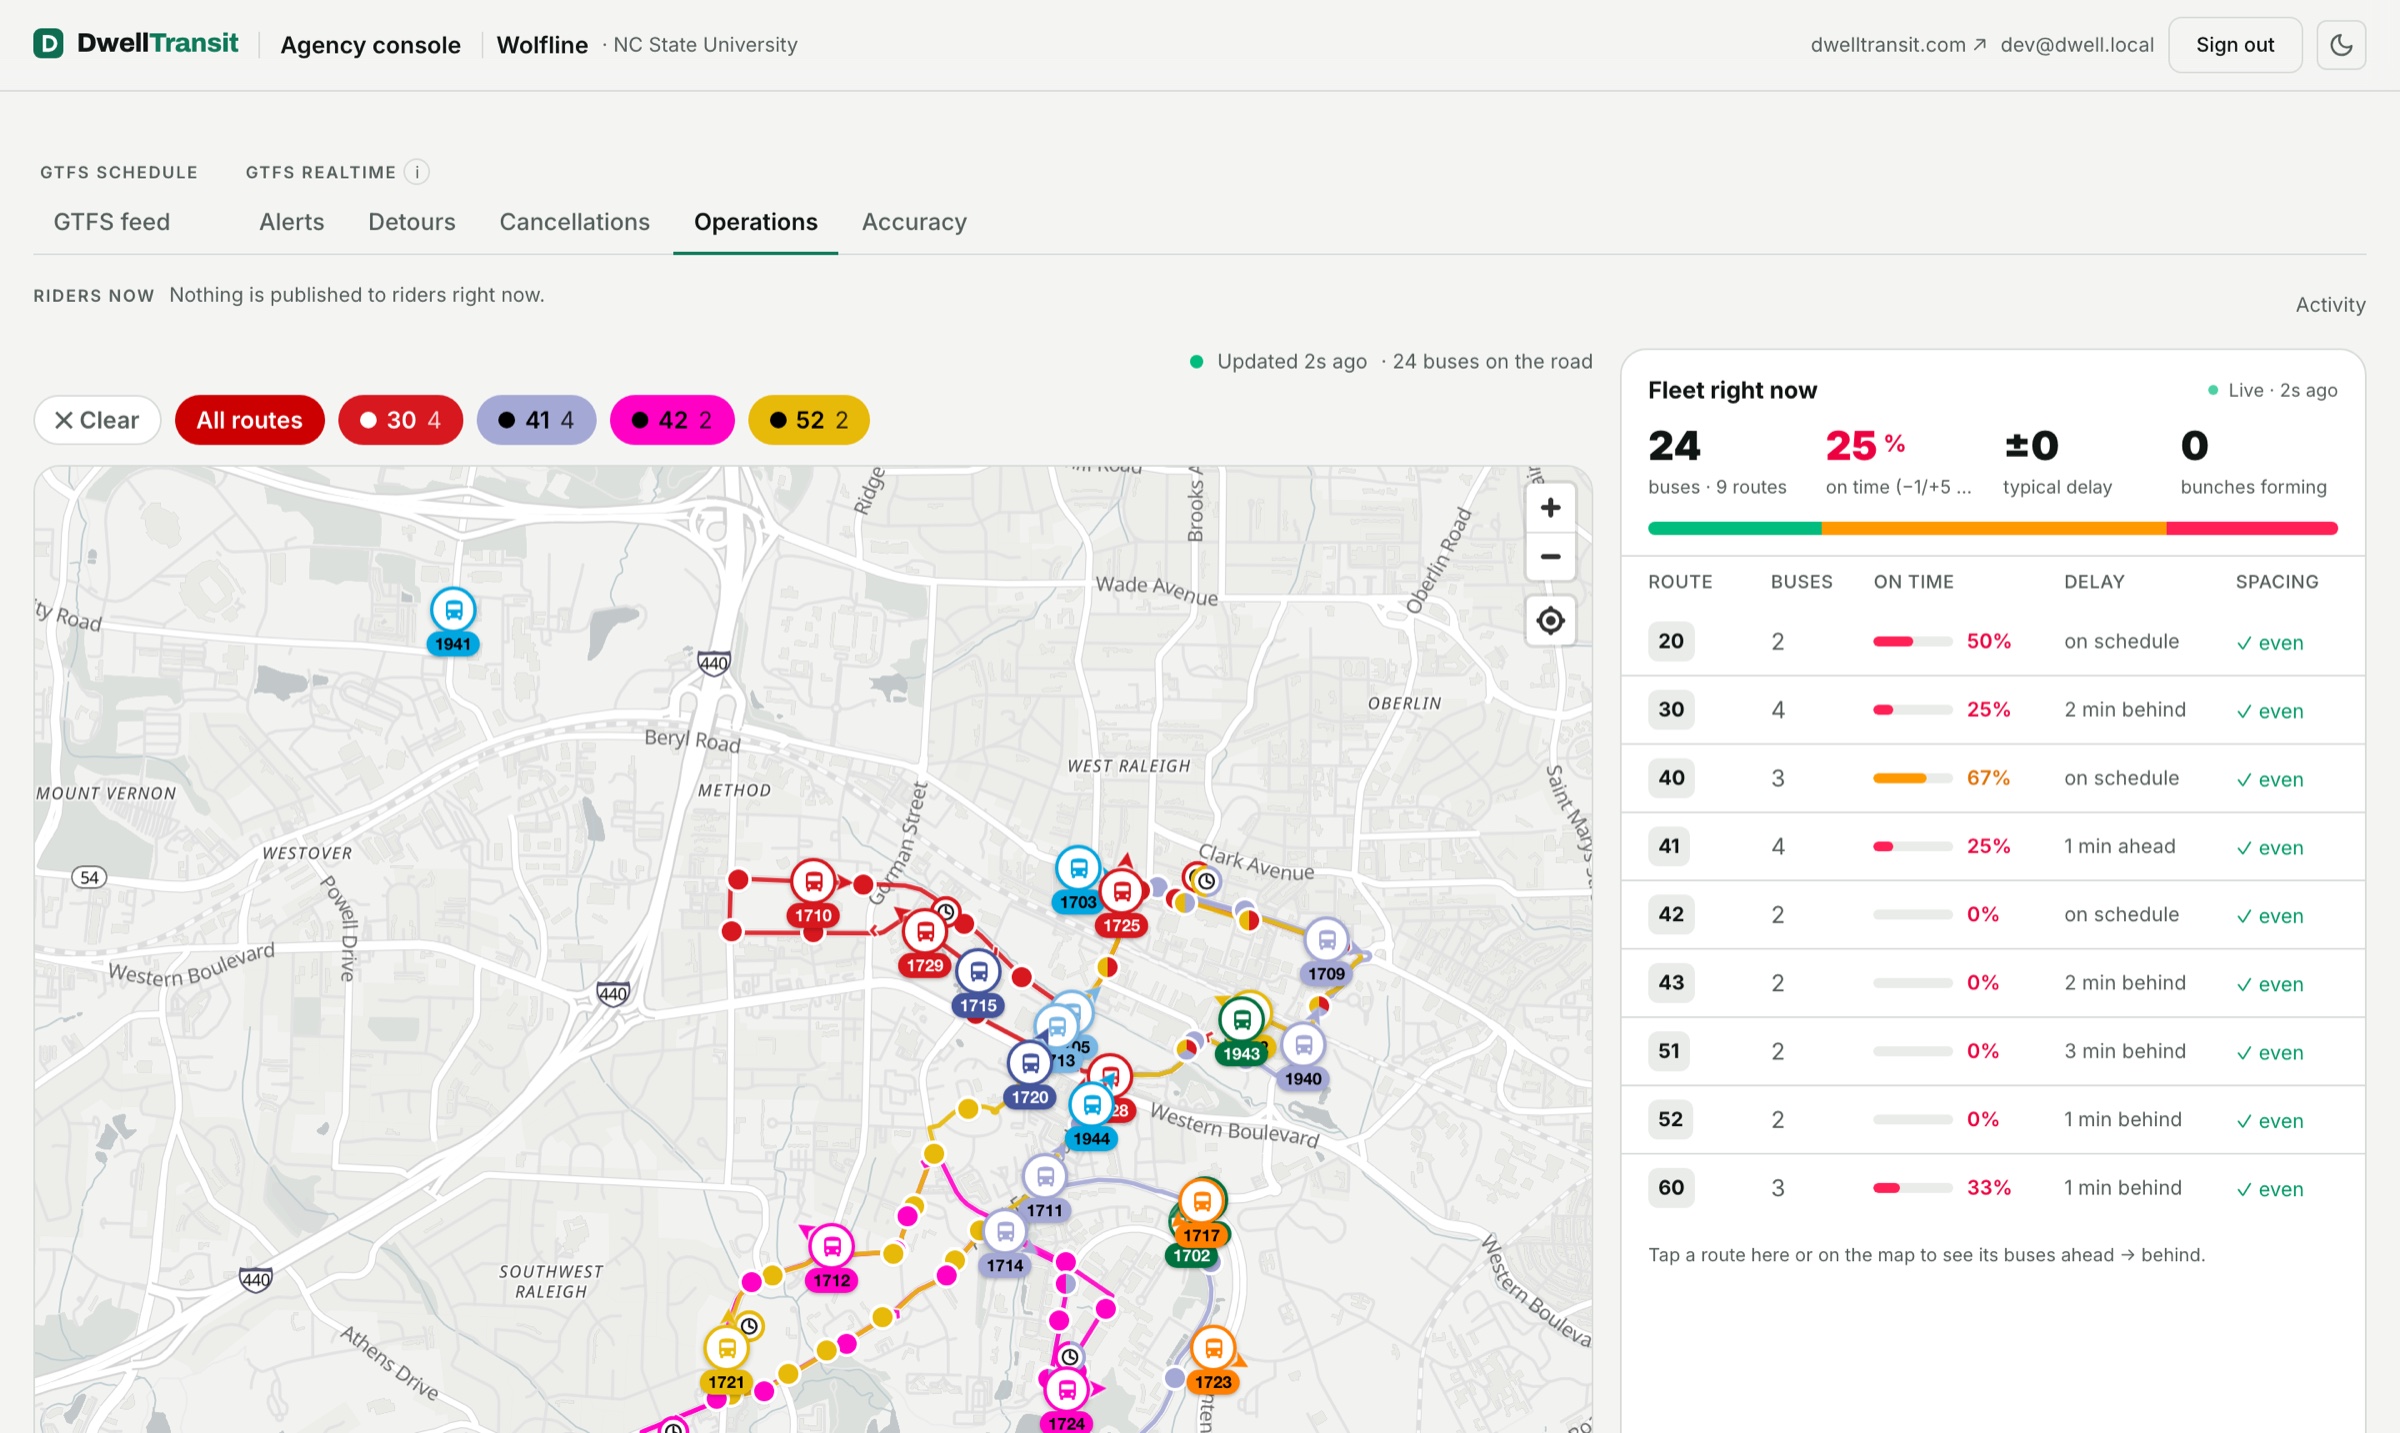
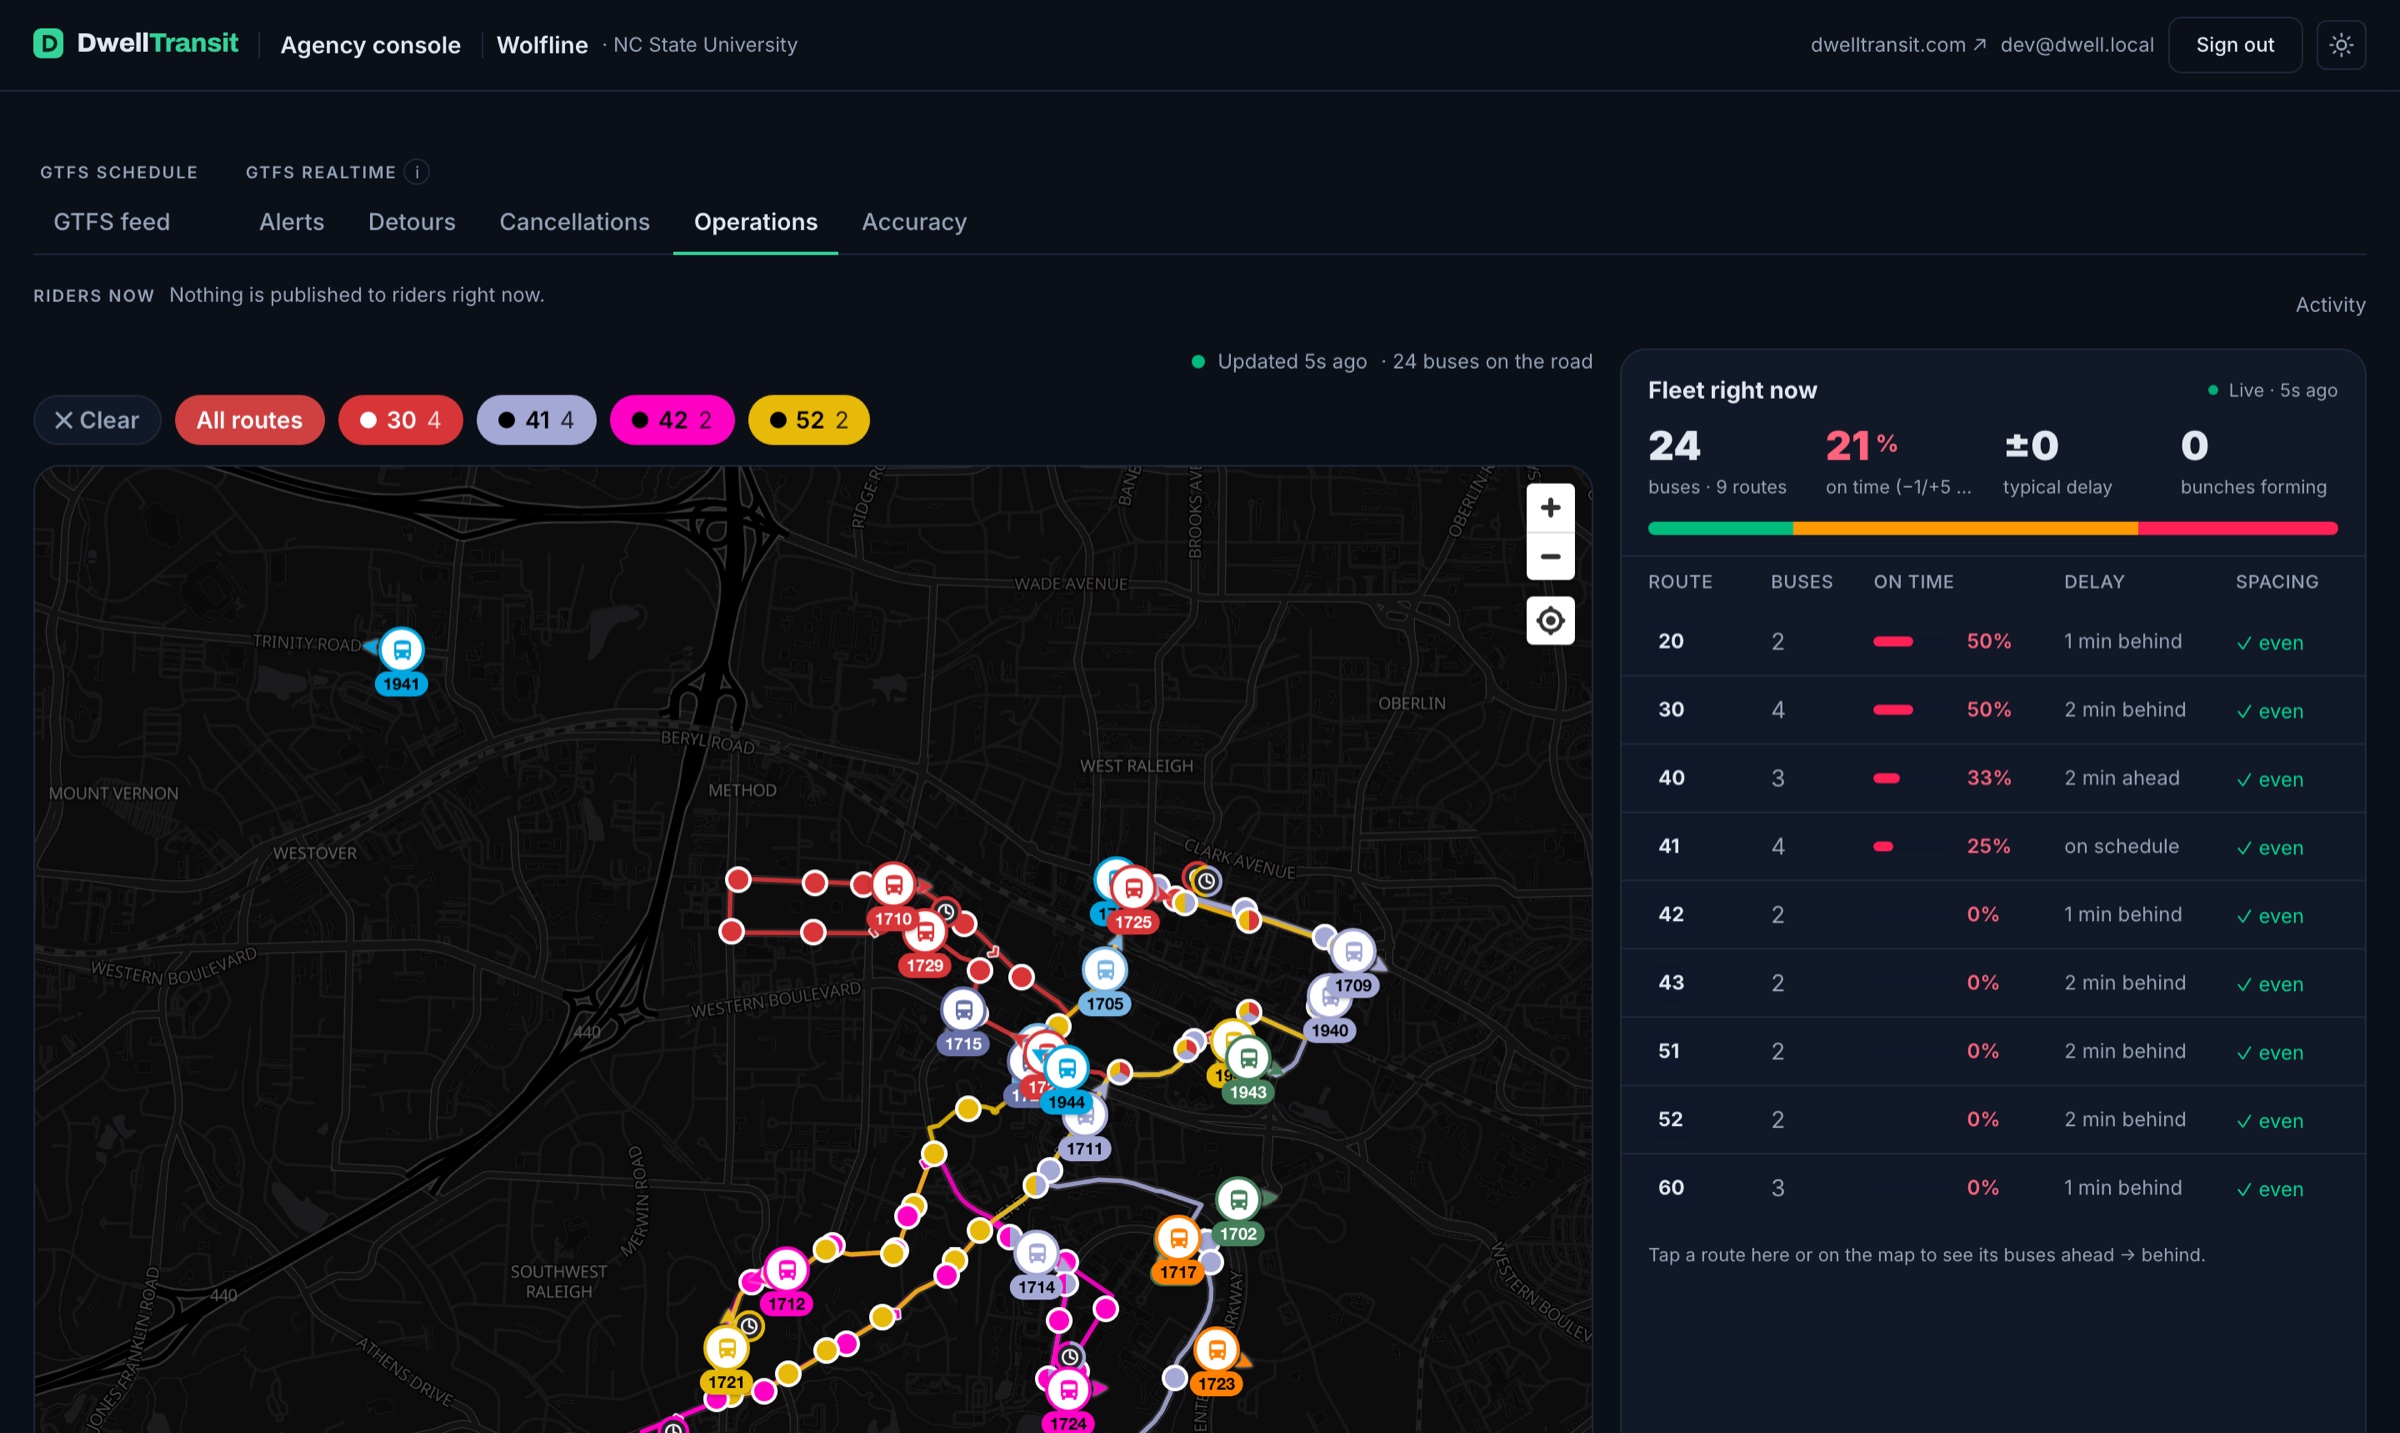
A per-vehicle operational view: on-time status, next stop, whether a bus is holding, and how it's spaced against the bus ahead. Read by: Dispatchers, the driver app
Every prediction compared with the recorded arrival, scored hourly against the open benchmark and published on this site. Read by: Anyone, riders and administrators alike
Riders
The same predictions, wherever a rider looks
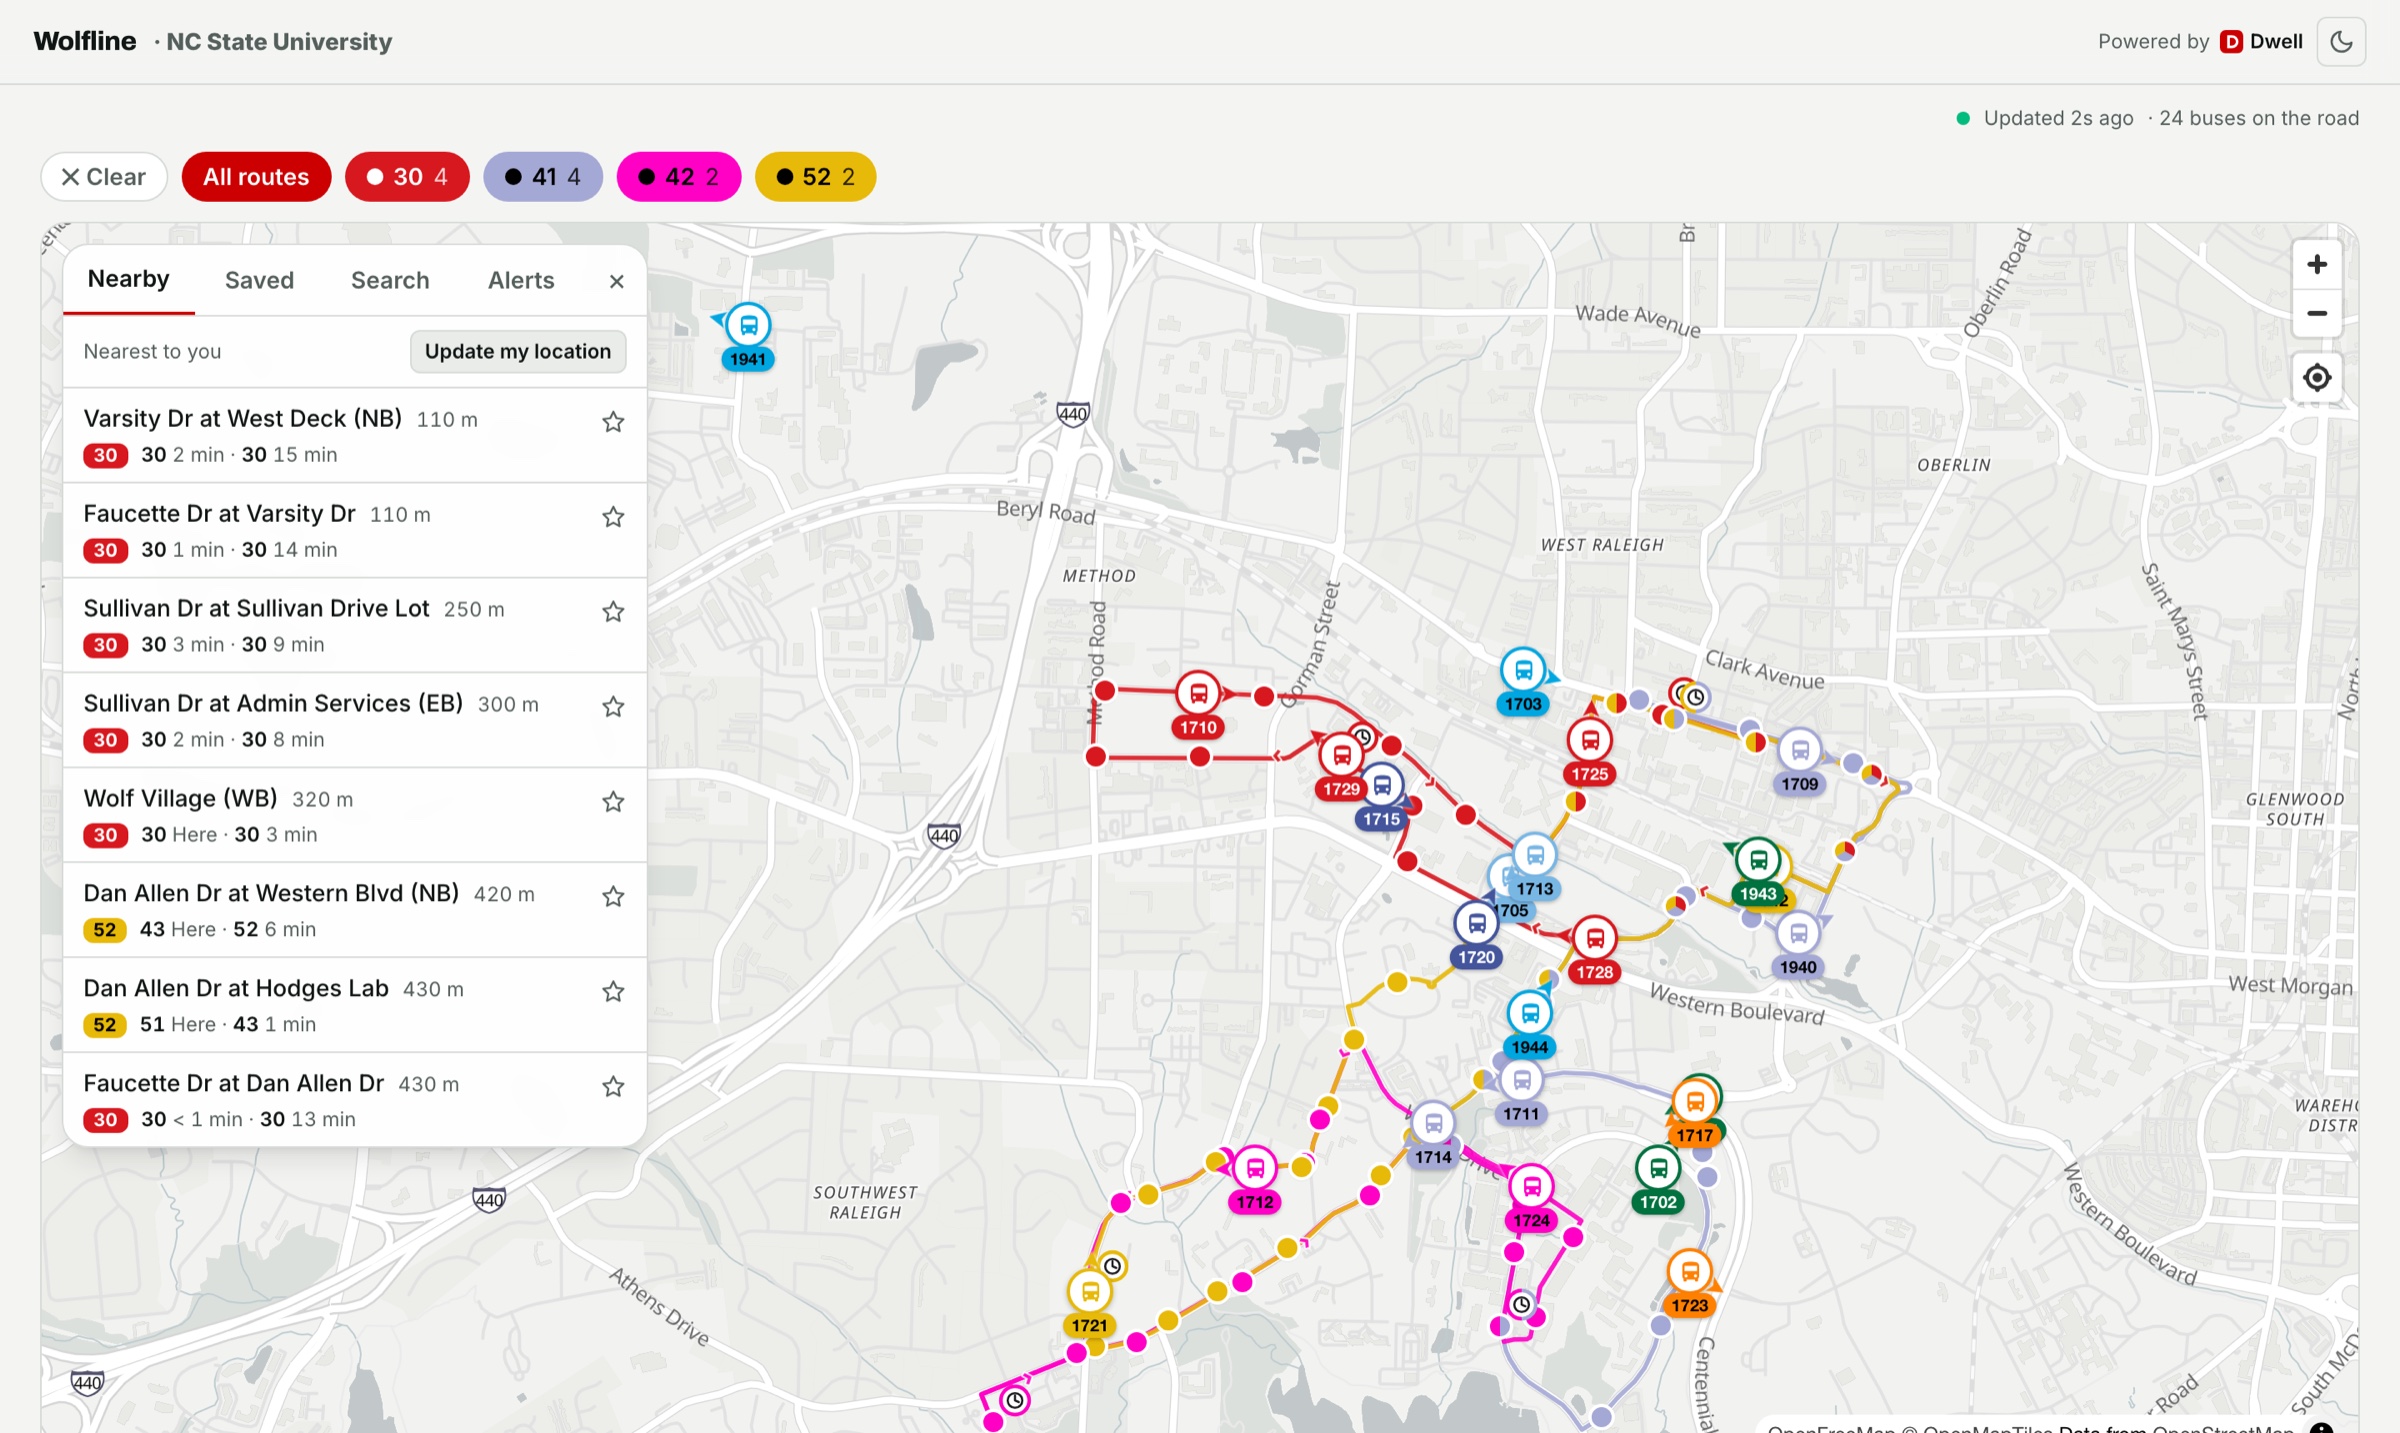
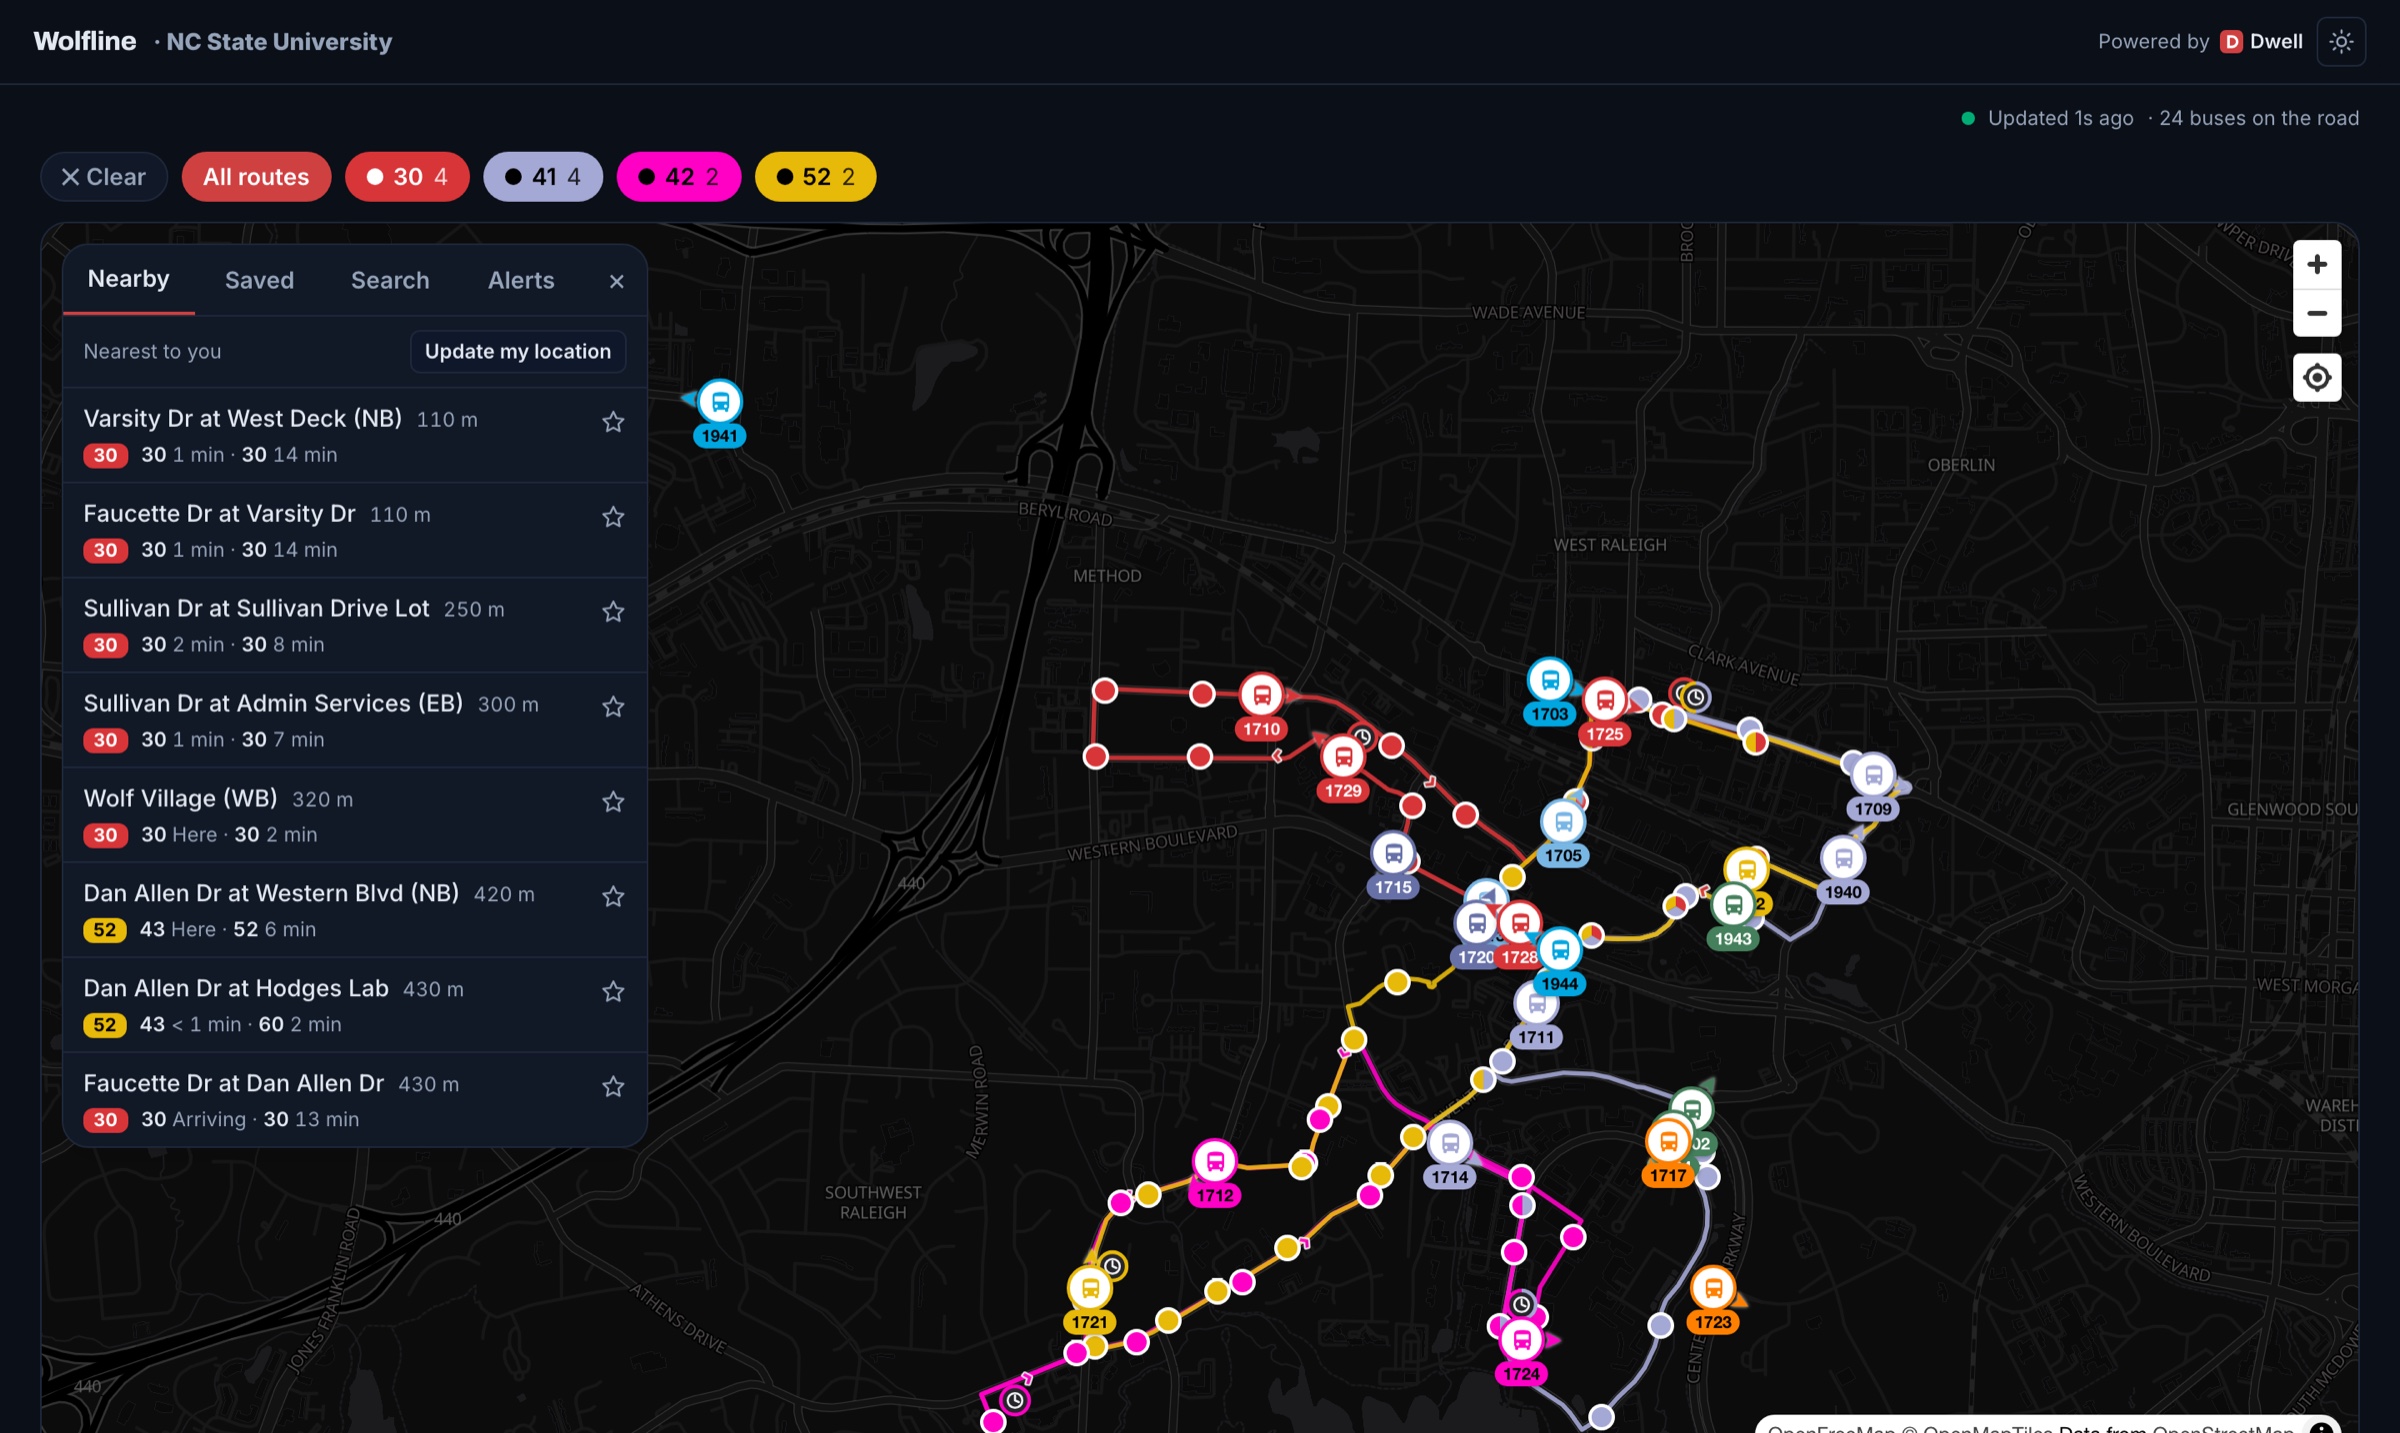
The live map is each agency's own web app, under its name and colours: every bus where it really is, the nearest stops with their next arrivals, search across stops, routes and buses, the service alerts in full, and a link to any stop that can go on a sign. It works in any browser and can be added to a phone's home screen. The native rider apps for iOS and Android carry the same data in the same branding.
When the road closes
Detours, alerts and cancellations, from one screen
Paving closes a street for a week; a game closes a lot for an afternoon. In the agency console a detour is drawn, not described: pick the route, draw the new path on the map, and the closed stops and any temporary stop derive from the drawing. Set when it applies and why, and the rider alert is drafted beside it. One publish sends both, so riders never get the geometry without the words.
For the days and hours the detour covers, the engine runs the route on the new path: closed stops are marked as not served, the new stops get arrival times from the start and sharpen with the first buses through, and nothing learned on a one-week street enters the permanent history. Apps that know nothing about detours still get correct times for every stop that is served; the live map and the rider apps also draw the path. A cancelled trip, or a whole block for an afternoon, is published the same way: marked cancelled in the feed, with its alert saying why, so nobody waits for a bus that is not coming.
And then it loops
Drivers see the same picture riders do
The same engine that answers "when does my bus get here" also answers "am I early, and how close am I to the bus ahead". Dwell's driver app shows an operator their schedule adherence, when to hold at a timing point, and their spacing on the route. It is shown as guidance, and the driver makes the call.
That closes the loop. A bus that leaves on time and keeps its spacing is a bus whose arrival times are easier to predict tomorrow, so operations and prediction accuracy improve together.
Accuracy
Then Dwell grades itself in public
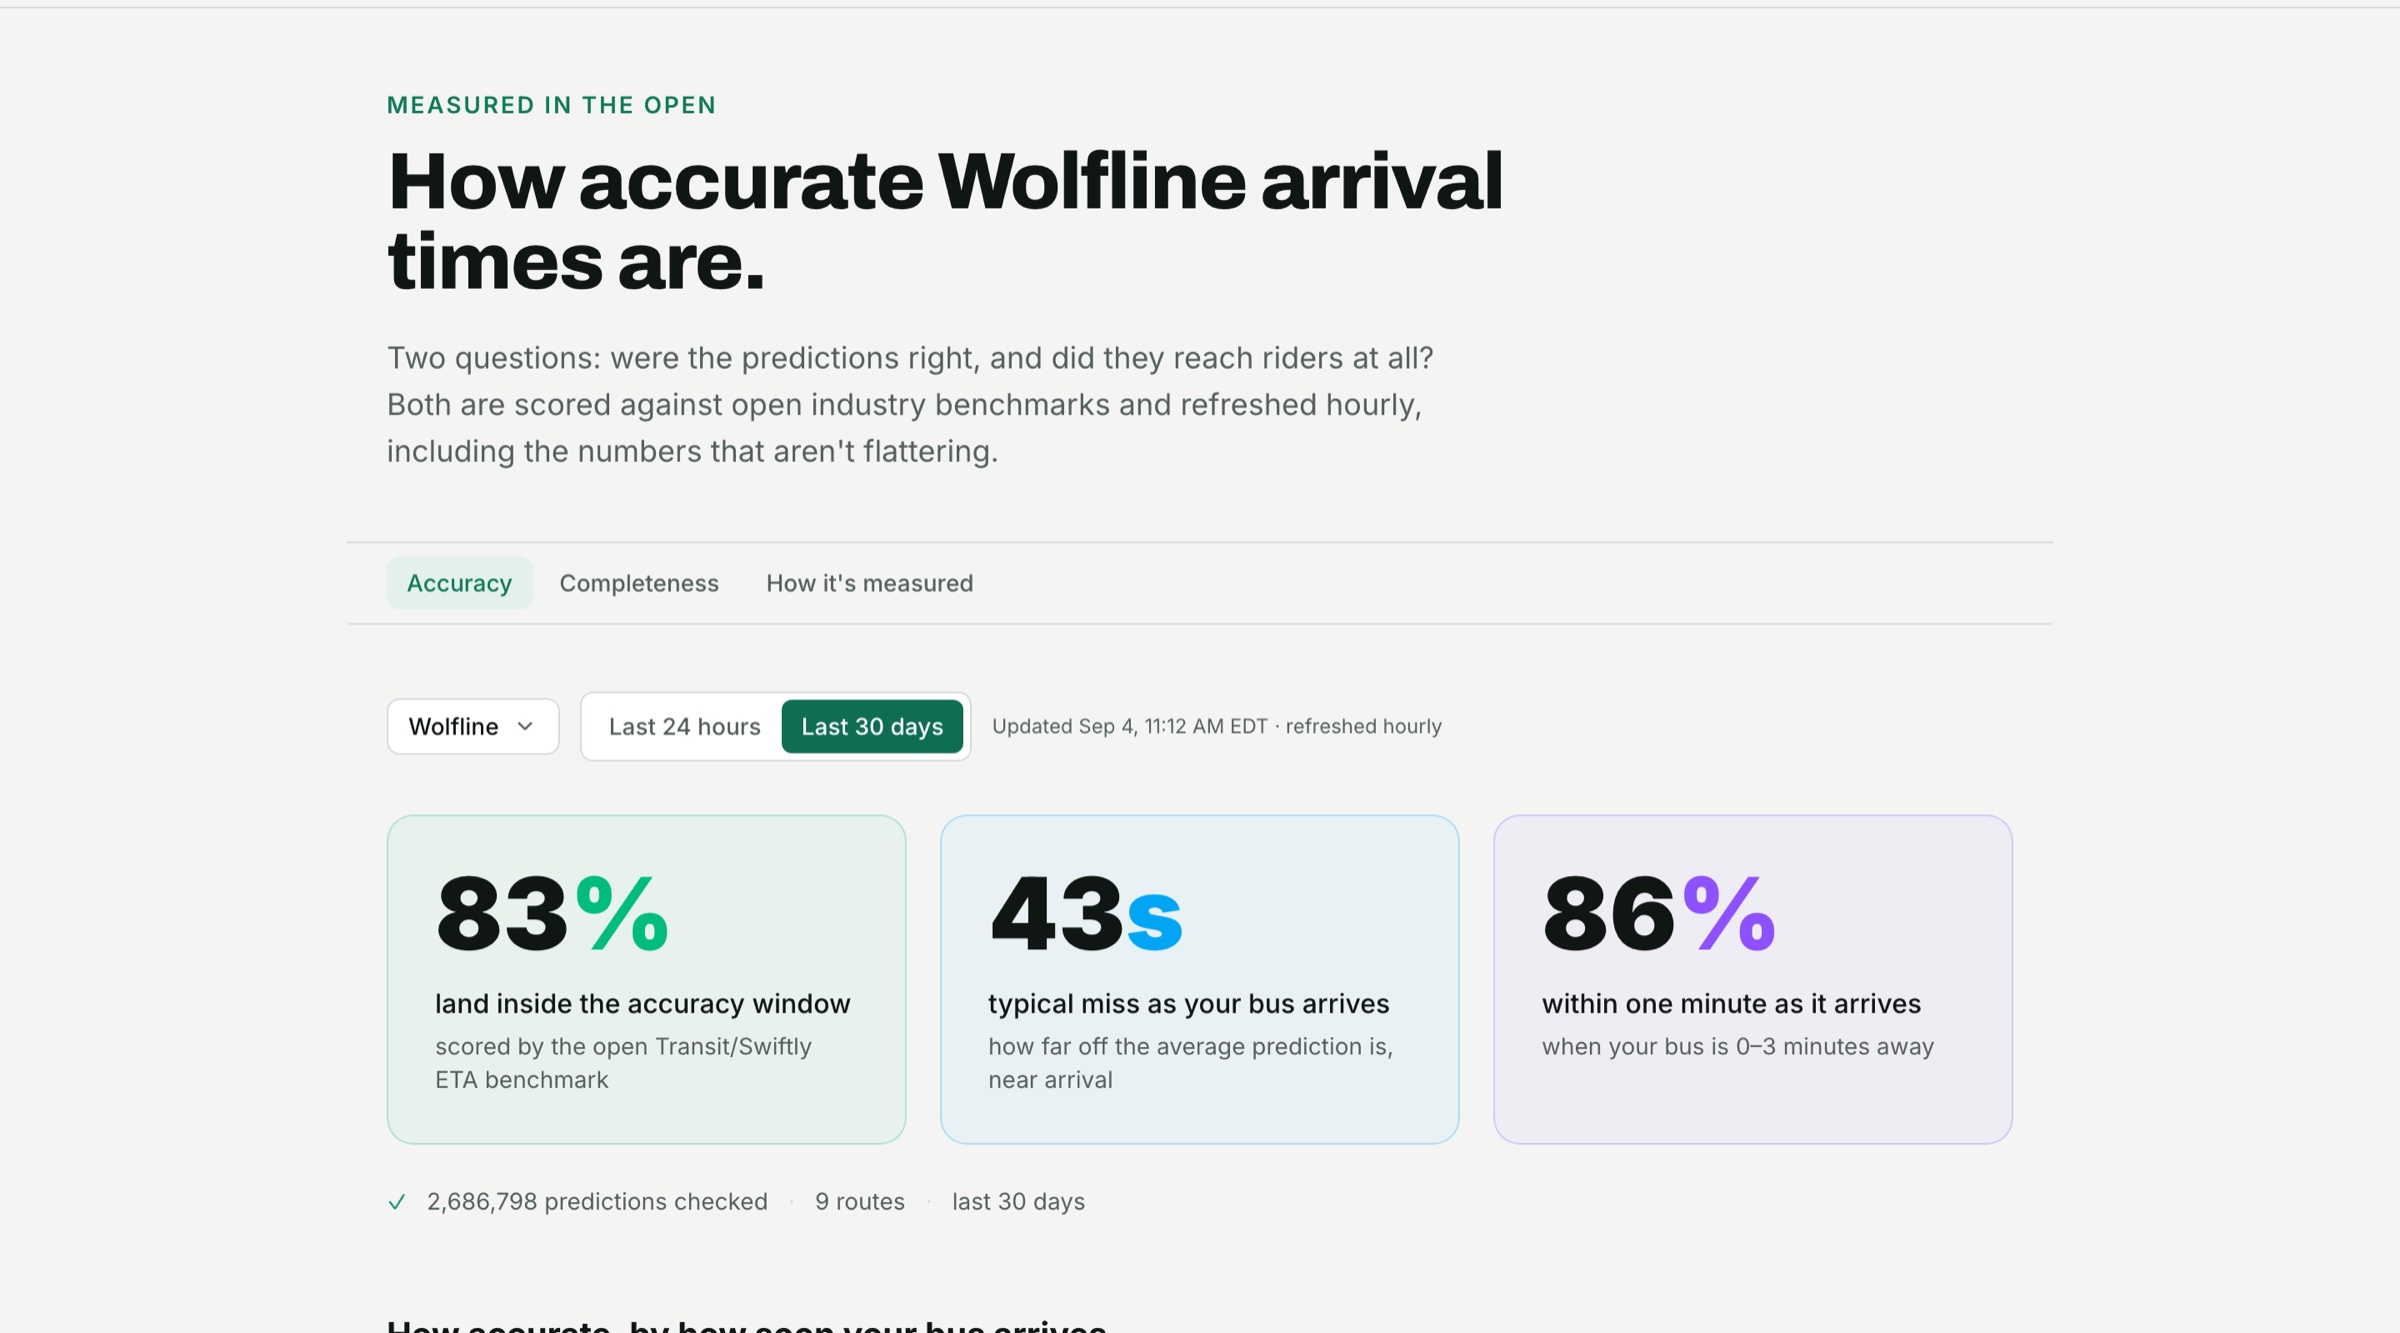
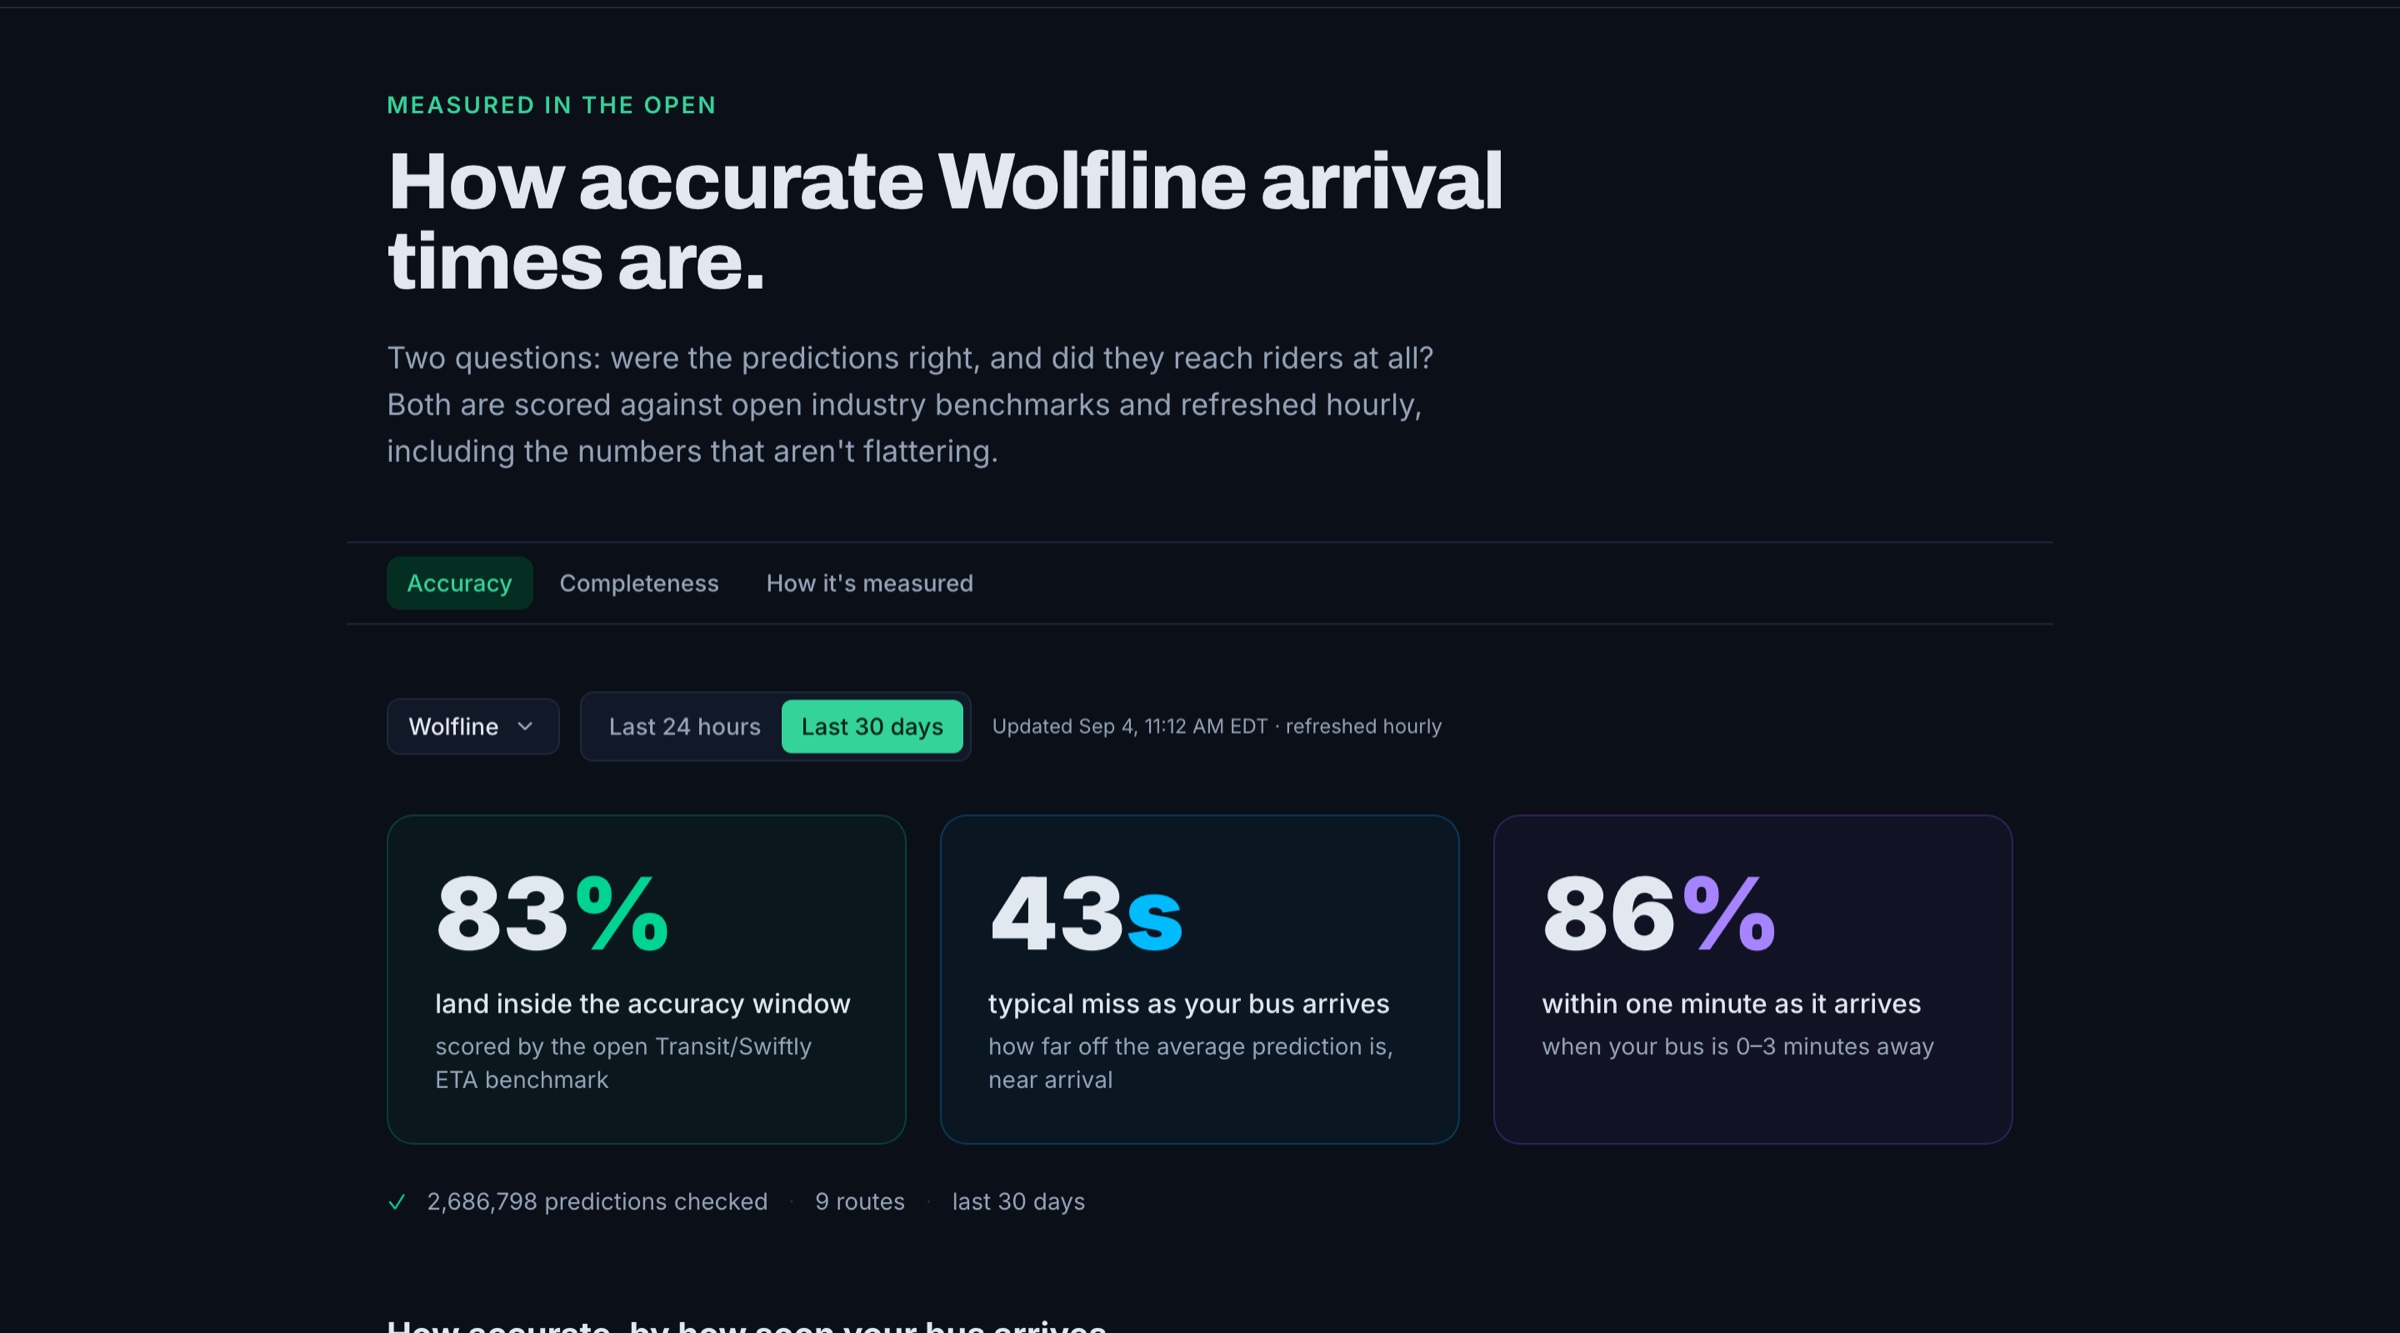
Every prediction Dwell makes is recorded and later compared with when the bus arrived. The results are scored against the open Transit/Swiftly ETA benchmark, using the same method and the same buckets, and published on this site, updated hourly.
The benchmark is asymmetric on purpose, and so is Dwell: being early counts as worse than being late, because a rider who arrives to a bus that already left has missed it. You can see the current numbers for yourself, including the ones that aren't flattering.
A good accuracy score is easy to get by predicting less, so the same page reports completeness beside it: how often a bus that was running had a live prediction at all. Neither number means much without the other, so they share one page.
Bring Dwell to your university
Send a note with your campus and routes, and Dwell will follow up with how it would work for your system.